
California Voters Pass Proposition 68
Land conservation was a big winner in the June 5, 2018 election in California. A sizable 57% of voters cast a “Yes” vote to pass Proposition 68, the first bond in fifteen years to authorize funding for water, parks, and natural resource areas. This creates $4 billion in infrastructure spending for state and local parks, environmental restoration and protection work, and water infrastructure and flood protection projects. A high priority is underserved people and places where the need is greatest.
Looking at results across the state clearly shows that voters in the nine Bay Area counties made the difference—with 69% voting yes, and San Francisco leading the pack at 80%. East Bay voters resoundingly agreed, with Alameda at 72% yes and Contra Costa at 62%.
If you’re curious—as were we—as to how votes in the two counties of the East Bay were distributed, the pattern is clear. Voters casting yes ballots were heavily concentrated in and around the urban centers—particularly Oakland and Berkeley. People in the more rural eastern parts of the the counties generally voted no. The range in results was quite large: from a low of 19% yes to a high of 96% yes across precincts in the two counties in which at least 30 ballots were cast.
Projects in the JMLT pipeline will benefit directly. If you voted yes— thank you! Your yes vote preserves beautiful natural places, supports wildlife, protects clean drinking water, and gives more people—especially children—greater access to the outdoors.
How Counties in California
Voted For Proposition 68
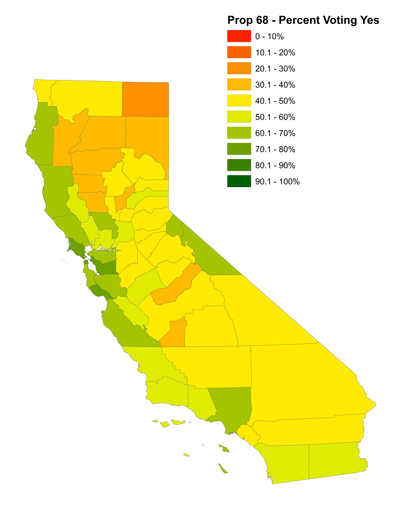
Percentage of voters in each county in California voting yes to approve Proposition 68 in the June 5, 2018 election. Counties are color-coded to show yes votes as a percentage of total votes cast either yes or no (i.e., ballots without votes cast on this measure are excluded).
How Precincts in the East Bay
Voted for Proposition 68
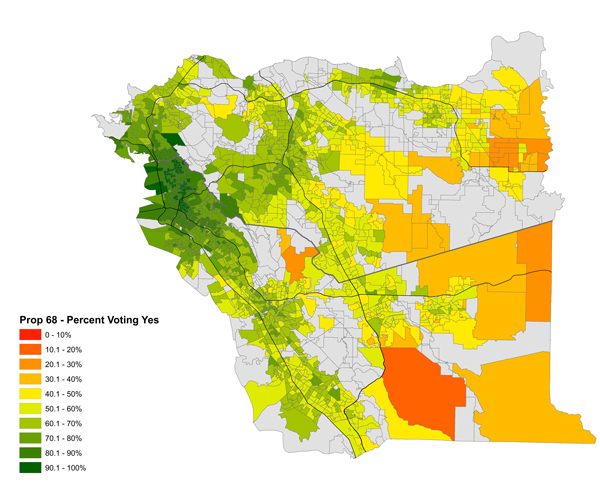
Percentage of voters in precincts in Alameda and Contra Counties voting yes to approve Proposition 68 in the June 5, 2018 election. Precincts are color-coded to show yes votes as a percentage of total votes cast either yes or no (i.e., ballots without votes cast on this measure are excluded). In precincts colored light gray, fewer than 30 ballots were cast. Major highways are shown in black, and the county boundary is gray.